Inflation, Crise, Krach, Boom, Hue | Comment anticiper où investir sur les marchés boursiers. Alors que tout le monde vous parle de l’inflation, de la hausse des taux , d’où investir quand l’économie surchauffe avec une forte inflation. C’est justement le moment de se dire que le consensus à un train de retard et travailler sur l’étape d’après sur les marchés financiers.
![BofA May Global Fund Manager Survey takeaways
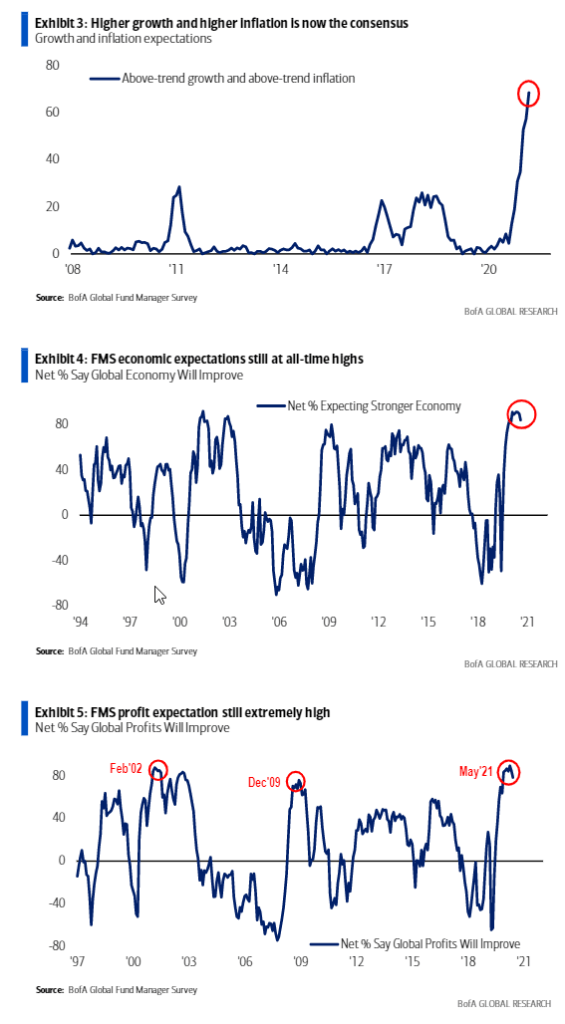
Bottom line: aofA May FMS snows investor sentiment unambiguously bullin 69%
expect "above-trerd" growth and inflation, a record high (Chart 1 "stagflation' (8%) mt
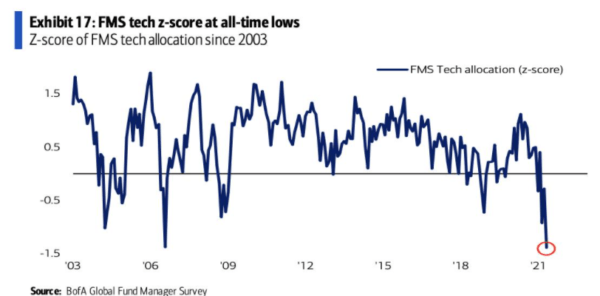
yet in vogue but Main St inflation triggering Wall St deflations (China tech, US hyper-
growth, XBT; nb FMS tech allocation z-score lowest ever).
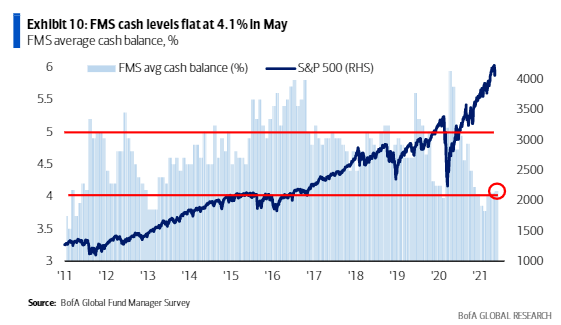
Cash: FMS cash levels low/steady4.l%; 80fA Bull & Bear Indicatorhigwsteady at 7.0.
Peak macro but not ylelds 12 signs "peak optimism" on growth (90% to 84% May),
profits margins (46% to 26%), capex (54% to 51%), inflation (93% to 83%); 5 peaks in
"FMS optimism" since 1994 followed by 75öps drop in 1 OY Treasury yield next 2
quarters, less likely in '21 as Fed policy stance so uber-easy that FMS investors see
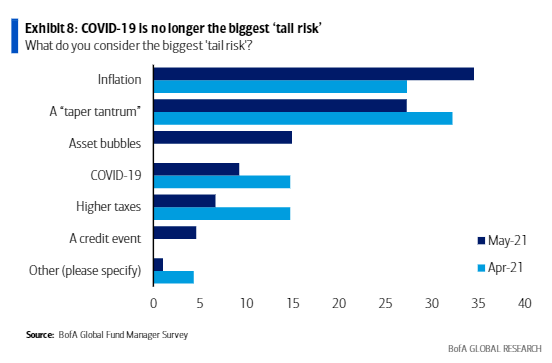
inflation (35%) and taper tantrum (27%) as biggest 2 "tail risks".
Qultcoln: most crowded FMS trade (43%) = long Bitcoin (75% say "bubble); note prior
"peaks" in crowded trades (e.g tech in SeV20 & Sep'18, US Treasuries in Mar'20, US
dollar in Jan'] 7 & Feb'15) associated witn tactical "tops" in relative performance.
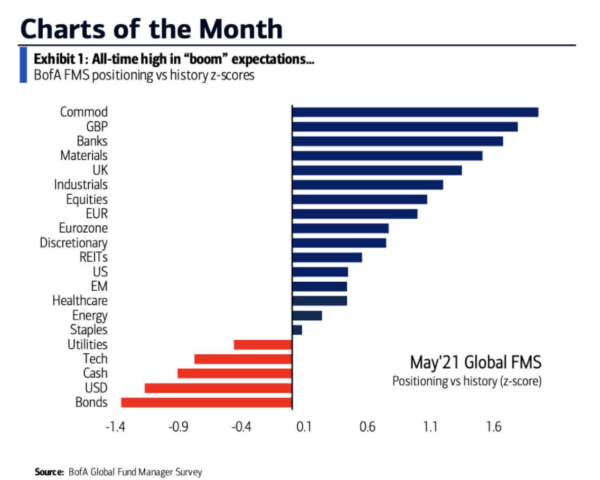
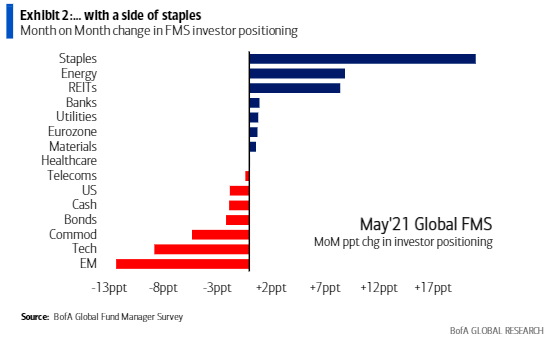
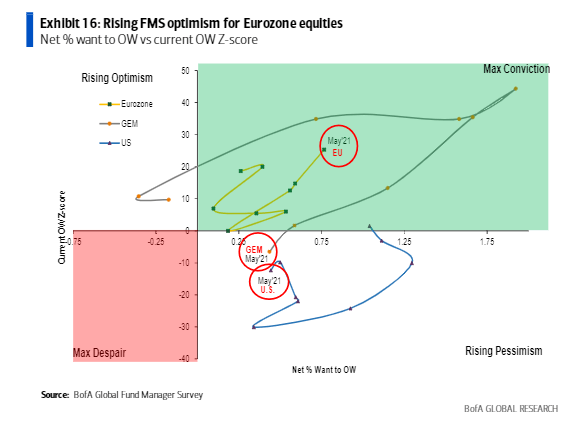
Posltloned for Inflation with a hint of defensives asset allocation to commodities
& cash up, to stocks down; sector positions in "late-cycle' banks & resources now
exceed 2006 highs, tech OW at 3-year lows, note furious May snort-ccwering in staples;
Euro-area #1 OW regionally, investors long UK stocks for since Jul'12.
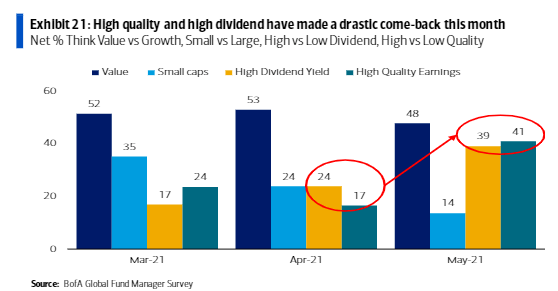
Up-in-quality: "value" remains most consensus outperformance "factor (48%), but big
April jump in "high quality" (41% from 17%) & "high dividend" (39% from 24%) factors,
mile "small-cap" continues to fade (14% from 41% in Jan).
FMS contrarian trades: stagflation bears (i.e. weaker growth) should Europe,
financials, materials, consumer cyclicals; inflation bulls (i.e. lower inflation) should go
long Treasuries, tech stocks, EM; our 1---Q cyclical value to defensive growth view here.
Chart 1 : BofA Investrnentaock (FMS edltlon)
Which of the folbvving do you think best describes the global economy in the next 12 months?
•Below-tÆna Growtn
I nnatlon•
FMS 4 %
8%
BofA
FM s 19%
FM 69%
GLæm](https://graphseobourse.fr/wp-content/uploads/2021/05/image-29.png)
Pas mal de chaînes de production ne peuvent pas compléter de produits finis faute de pièces et bcp d’entreprises dans le milieu du tourisme ne trouvent pas d’employés faute aux aides encore majoritaires qui ne poussent pas les travailleurs à se jeter sur le premier boulot venu. Pic inflationniste temporaire, mais risque de coincer la croissance court terme.
Biais de confirmation :
UNE ÉTUDE MENÉE AUPRÈS DE CONSEILLERS FINANCIERS RÉVÈLE QUE LE « BRUIT » ENTRAÎNE D’ÉNORMES INCOHÉRENCES DANS LES NIVEAUX DE RISQUE AINSI QUE DANS LES CONSEILS D’INVESTISSEMENT FOURNIS AUX CLIENTS
Cette étude menée par les experts en finance comportementale d’Oxford Risk a donc révélé que pour un même client hypothétique, les conseillers donnent des « avis très différents » sur le niveau de risque à appliquer et suggèrent des allocations d’actifs « extrêmement inconsistantes ». Même dans les cas où les conseillers sont d’accord sur le niveau de risque, ils sont souvent en désaccord sur le type de portefeuille à recommander aux clients
bon rien de neuf, mais juste pour souligner encore une fois, de vous méfier des experts, de faire confiance au sentiment de marché, à la psychologie des foules qui est dans le graph pour éviter le bruit CT
![13, 2020
l].S. 10-Year Treasury Yleld](https://graphseobourse.fr/wp-content/uploads/2021/05/image-33-600x328.png)
![EURUSD
Prix
G]
1,22511 spot EUR/USD
200 unitâs
Hebdo
@ Pro Time Tradin Donnğes en
1,26
1,24
1 23008
11
ı ,20403
1,13850
1,18300
1,17797
1 15941
1,15727
1,14426
1,12
1,08
1,06
1,04
501 126](https://graphseobourse.fr/wp-content/uploads/2021/05/image-36-600x286.png)
amicalement
Julien
Note: Tous les trades sont discutés, annoncés et partagés en temps réel sur L'Académie des Graphs.
Sur le site public ici, Le portefeuille est mis à jour une fois par jour vers midi. Le portefeuille représente mes convictions personnelles consolidées (de mes différents courtiers) et n'est pas pas une incitation à l'achat ni à la vente. Il s'agit de mon portefeuille dynamique donc agressif. J'ai un autre portefeuille bas de laine long terme diffusé exclusivement sur l'Académie des Graphs. Mon capital et mon horizon de placement sur chaque titre ne sont surement pas les mêmes que les vôtres. Le portefeuille est là pour partager avec vous en toute transparence mes convictions au quotidien mais n'a pas vocation à être suivi.
La performance annuelle inclus les gains ou moins values latentes des positions en cours. Cela inclus aussi les gains ou pertes de change sur les actions hors Euro (c'est reflété dans la perf de chaque action individuelle). Les éventuels retraits sont annoncés. La performance est donc en net.
Performance 2023: +38%; 2022: +46%; 2021: +122%; 2020: +121%; 2019: +79%; 2018: +21%; 2017: +24%; 2016: +12%; 2015: +45%; 2014: +30%; 2013:+72%...